Chapter 7 Subnetwork analysis
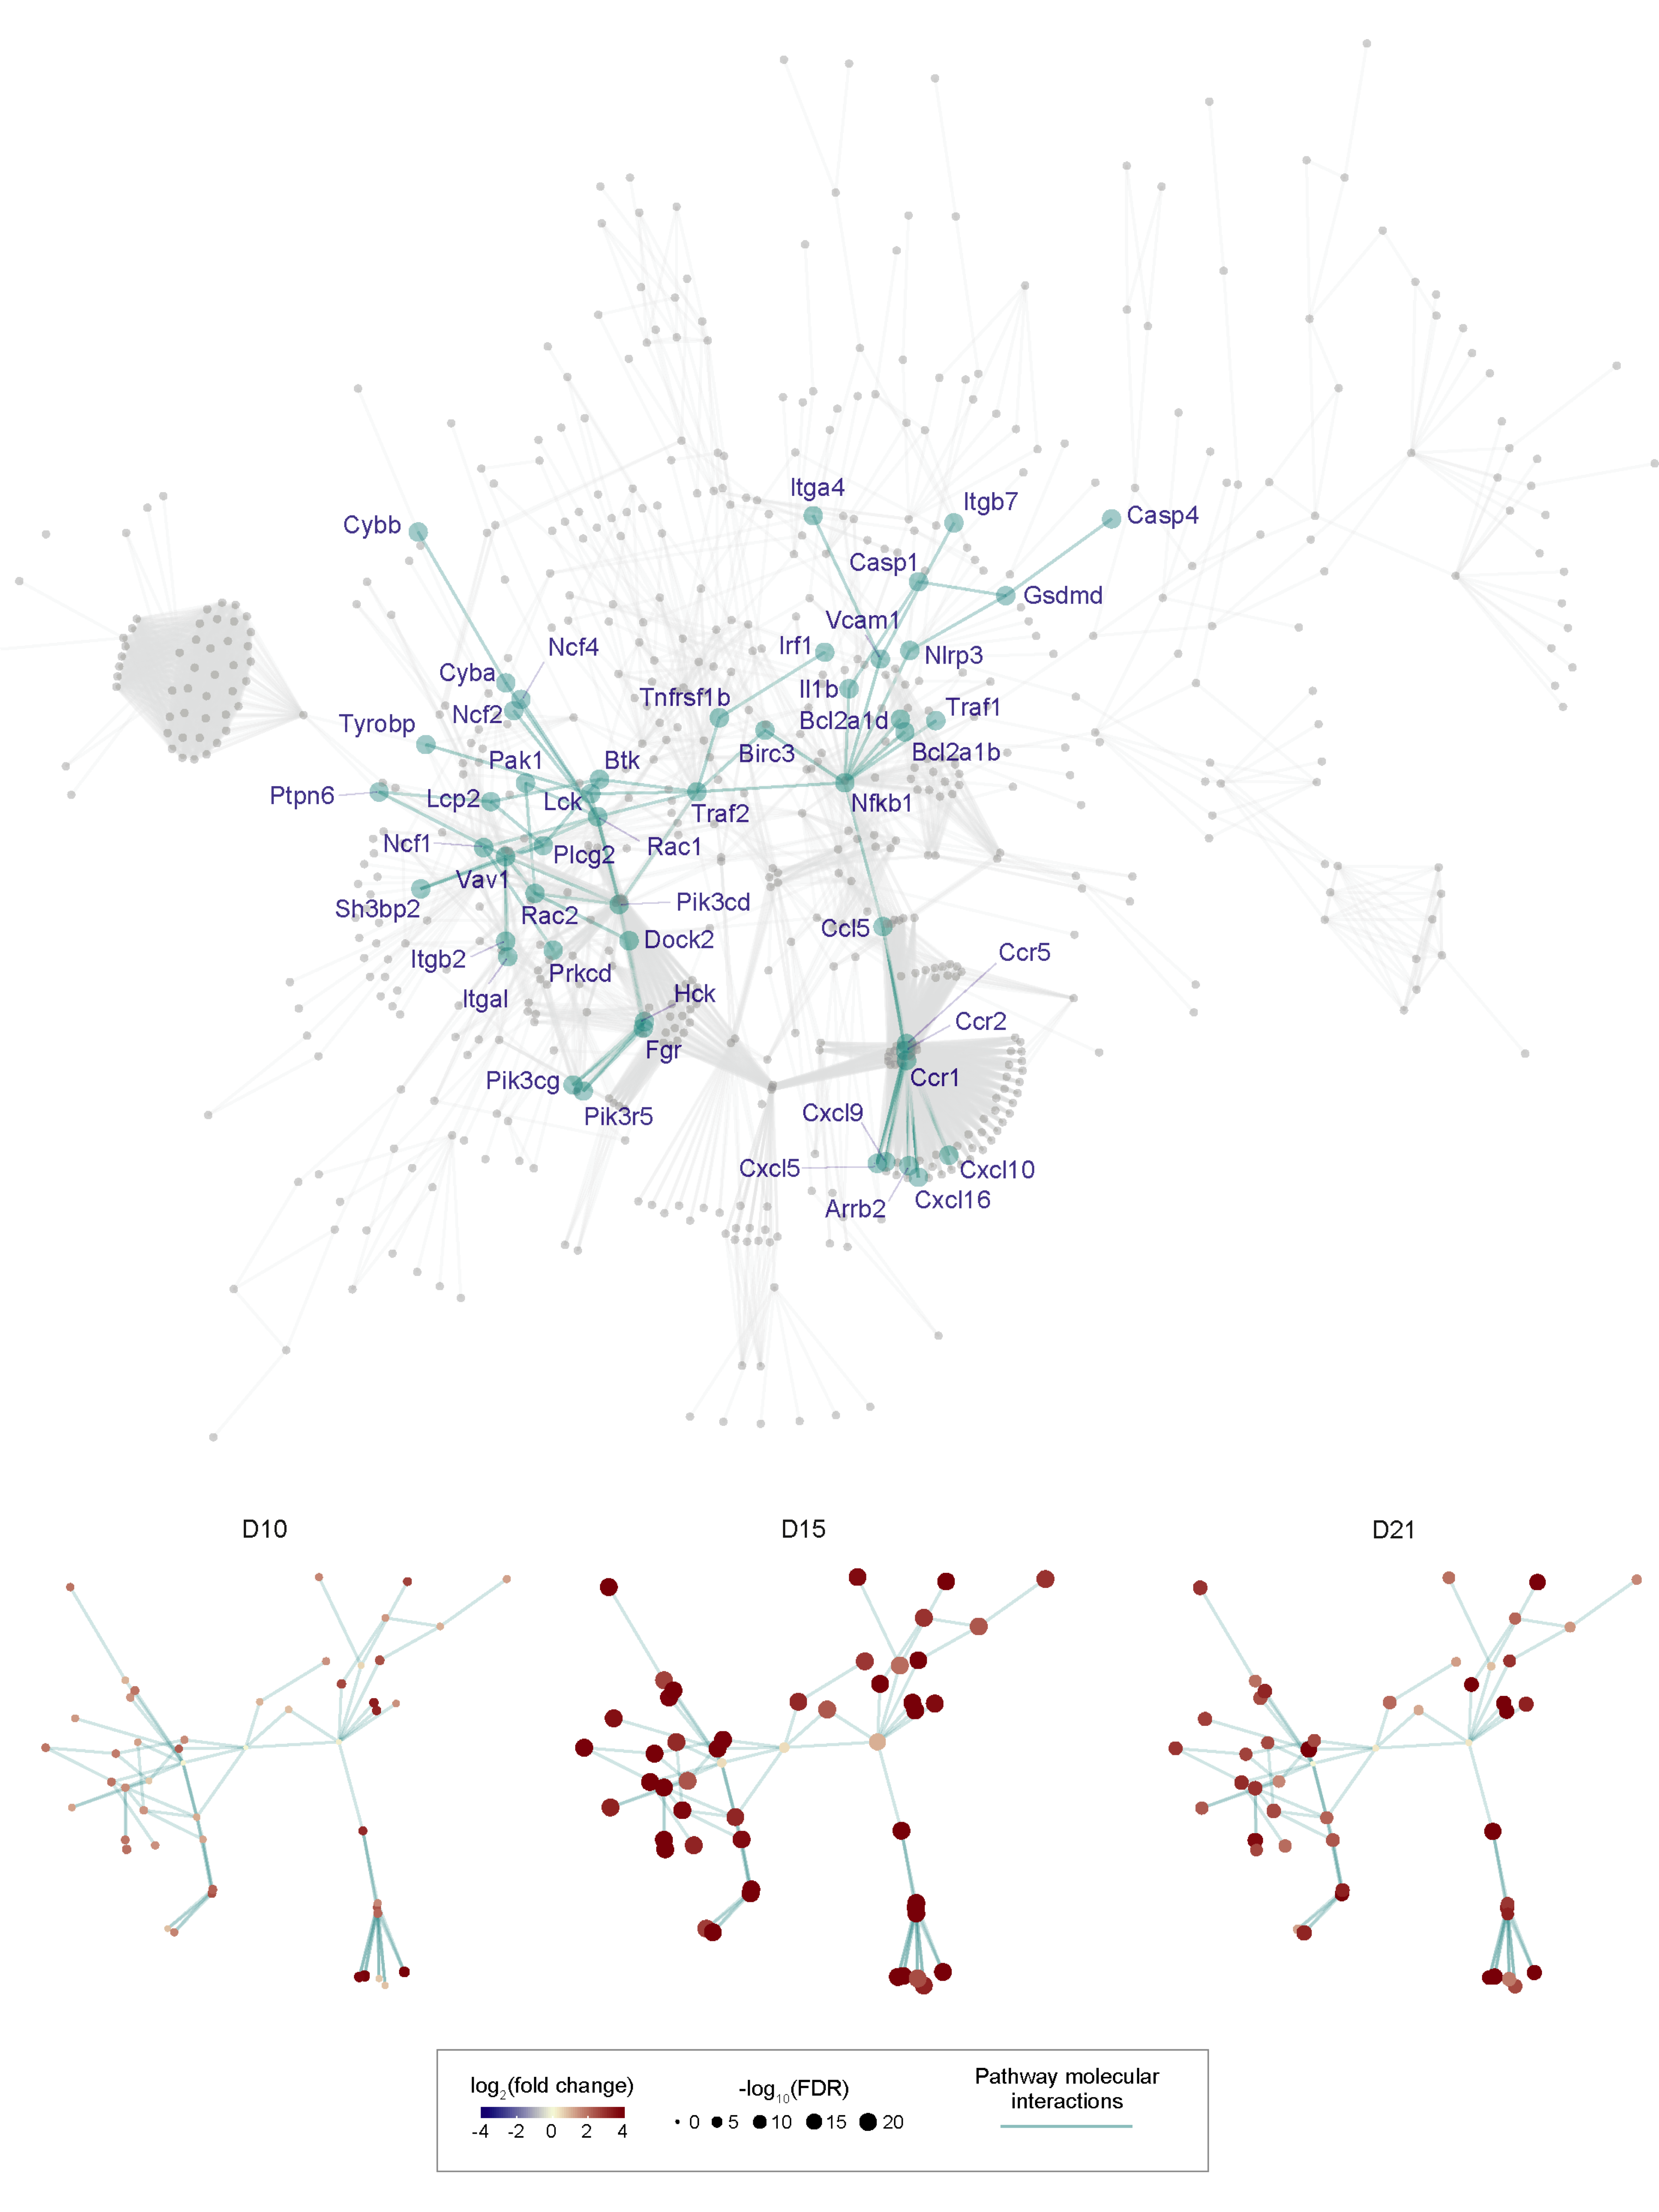
We perform an integrated analysis of KEGG molecular interactions with gene expression changes at different time points and identified a subnetwork of 50 gene nodes based on their expression importance over time. The cascade of subnetwork activation is visualised through the course of the disease process, where fold change over time and differential significance of individual genes is indicated by color and size respectively of individual gene nodes. For details, please refer to our paper.